
Managing Negative Supply Shocks
Inflation & The Nature of Price Shocks

Today’s oil price shock risks stagflation – but unlike the 1970s central banks have a closing window to prevent it if they act. The large surge in inflation following the two oil price shocks in 1973 & 1979 saw inflation peak at 14.6% in April 1980 and required a central bank induced and severe recession to regain control. Today’s oil price shock is of a similar magnitude and rpesents similar risks.
The coexistence of high inflation and high unemployment through the 1970s was miserable, giving birth to the misery index the sum of these two variables hitting a high of 21 in 1980. Sitting at 7 today things aren’t yet miserable, but emotional policy making in Washington raises the stakes that a measure of misery may yet come.
Stagflation arose from pre-oil price shock flaws in policy making which tried to trade-off higher inflation for lower unemployment which did little more than ratchet inflation and inflation expectations up. When the oil price shock arrived inflation took off. We are in a better position today as decades of inflation targeting leaves us with the knowledge, tools, and experience to manage an unwelcome surge in inflation that is close to the 2.0% target and inflation expectations are better contained than they were in the early 1970s.
Today’s shock is big, and we can’t rest on our inflation control laurels and do nothing so we need to know what kind of shock we have.
Oil price increases can be supply or demand driven. Negative supply shocks move inflation up and GDP down so the two move in opposite directions, this is the pattern of the 1973 & 1979 oil price shocks. Demand shocks move the oil price level up and GDP up so inflation and growth move in the same direction. This we observed in the early 2000’s following China’s rapid economic expansion.
Today we can rule-out a demand shock, what we need to get to grips with is whether the oil price increase is a temporary or persistent shock as there are much different inflation management implications.
The chart shows what taking-out twenty percent of global supply, which can neither be rebuilt quickly nor satisfied elsewhere, will do to prices. The short-run supply curve moves to the left (S1 to S2) and prices double ($60 to $120). While supply may fall below the 100 MM barrels a day needed to power the globe, the price does not capture a long-lasting loss of supply as the market has bet supply will roar back at the end of hostilities (despite production infrastructure damage in the Gulf.) This is today’s bet.
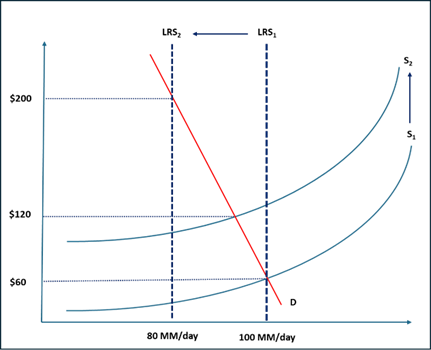
However, if the conflict escalates and supply potential is destroyed, then the long run supply curve shifts left (LRS1 to LSR2). The price could easily gap to $200 and beyond. This is devastating for inflation control and global growth as monetary policy will have no choice but to tighten and tough-out the ensuing recession until the inflation shock has been contained. It won’t be pretty.
The crucial management issue is the duration of the price shock-- is it temporary or persistent? If oil prices go back to their pre-war level in a matter of months then this year’s inflation will be next year’s deflation. Some of the price increase will get into core – all items inflation less food and energy and the better predictor of future inflation – but it will not be sustained. Core and all items inflation will converge at a slightly higher rate than before. This may require a monetary response – either no more easing or even a small tightening -- but it won’t be a major interest rate event.
In contrast, a permanent increase in the price of oil will first raise all-items CPI inflation, which will dissipate once the oil price settles at the new and higher price. However, all-items and core are more likely to end up at a higher rate, above the 2.0% target. And, past modelling shows that core will continue to drift up. This is not what the central bank wants to see nor where it wants to be, as a sustained and higher rate of inflation in the presence of unchanged nominal interest rates, will deliver an unhelpful passive easing in real interest rates.
CPI inflation can both settle in at a higher rate compared to the pre-shock level and also build upward momentum that would require a response.
Look Out for Forecast Errors
Monetary policy decisions are based on central bank forecasts of which interest rate path is most likely to keep inflation on target two years from now. Prior to the conflict, the Fed has been on hold since December 2025 tilting its risks to the downside. Rates have been on hold likely because inflation has not returned to 2.0% in the post Covid period and that any easing would only have come on a downside forecast surprise. That no longer seems likely.
This is the biggest and fastest energy price shock since 2022 and is rivaling the 1970s. First comes the price response and then the supply scarcity which is now mere weeks or days away. I am old enough to remember speed limit reductions and car-free Sundays in the Netherlands as scarcity’s bite was felt across the globe.
The Covid-era supply-chain disruptions showed us how quickly the market can respond to price changes. Supply chain managers showed they can regroup and redirect supply relative to bottlenecks. But producers also learned how to respond to price signals, suggesting that the pass-through of higher energy to core inflation may be faster than anticipated.
Food prices, already stressing consumers from the surge three years ago, will quickly rise. Fertilizer price increases have already been reported just as the spring planting for summer growth is underway. More to the point, it takes between seven and ten calories of fossil fuel energy to produce and distribute each single calorie of food consumed in advance countries.
Finally, the use of algorithmic pricing is increasingly widespread so the speed of price changes will be both fast and asymmetric, meaning prices go up the elevator but will come down the escalator. Price persistence will be a key feature of this supply shock.
The inflation of 2021-2023 was a wake-up call to central banks, who misjudged how much excess demand was in the system as economies opened-up after the Covid lock-down. Large wage increases necessary to restart domestic service economies collided with large relative price changes necessary to restart supply chains. A relative price change that was seen as temporary became an economy-wide price change, and inflation rose far above expectations that required central bank tightening to contain.
Central banks were late to the party and they won’t make that mistake again. The US in particular is in a very difficult position, as post Covid US inflation has remained well above 2.0%. Energy prices are rising at 6.3% on a year-ago basis and food is rising at 3.1%. Pre-shock, one-year ahead, inflation expectations were 3.6% in February and they are very sensitive to energy prices. They are likely substantially higher than the 2.4% ten-year break-even inflation rate. Consumer and investor inflation expectations are diverging.
It is tempting to think the Fed can “look-through” the oil price inflation shock as a one time increase in the price level. However, this is unlikely to be the case today. The Fed’s favoured inflation measure, the core personal consumption expenditure index, was running at 3.1% at the start of the year. Pre Covid, core good price inflation was -1.0% on a year-ago basis. It temporarily surged to 8% on lockdown reopening, ending up at about -1.0% again in 2024. However, we are back to positive 2.0% again. Years of goods price deflation was a key offset to core service inflation of 3.0%. And, it is likely that the 2025 tariffs have yet to feed into PCE inflation.
Today’s initial conditions are inconsistent with a do-nothing Fed stance. It, along with others, has learnt from the Covid experience that even a temporary shock requires action to ensure it remains temporary. Key today is to contain a rise in inflation expectations which have not fully converged to the 2.0% inflation target. It’s better to start with short-term interest rates at 3.50% than 0.25% but this is no assurance that inflation can be contained at the current interest rate.
Look Out Below
The market has concluded that a presidential tweet-storm is the equivalent of a ceasefire treaty and is again looking for easing into the end of the year. Please, call me Casandra. Permanent energy price shocks have a long tail. For example, higher diesel prices are transmitted immediately but it takes time for higher energy prices to raise the cost of making a truck.
US self-sufficiency in oil does not insulate it from the impact of a higher global price of oil. The price impact is immediate and the cost response is lagged. First, transportation demand for oil in a country as vast as the US is inelastic, so income is transferred from consumers to producers. Oil producers and shareholders both have a smaller propensity to spend. This should do some of the adjustment for the Fed, especially since the labour market is already weak. But its likely not enough.
Lower income cohorts will experience an unjust measure of pain. High income households are sustaining consumption from their gains in wealth, but this will be at risk given the transfer of resources to a more concentrated group of oil producers and shareholders. More importantly, if all equity markets experience a significant drawdown that is not offset by the higher profits and the share prices of energy producers, then GDP growth will inevitably slow. This is a plausible risk.
We don’t know at what oil price the growth versus inflation trade off frees the central bank’s hand. Central banks are not going to pre-emptively tighten, but if we start to see inflation higher than expected, and more persistent than expected, then rates will go up and growth will go down. The lesson from the 1970s was don’t ease into lower-than-expected growth until you are sure you have met your inflation objective. The AI crowd will cry foul arguing that its expected productivity gain will absorb the inflation shock. Again, it is better to be surprised positively rather than negatively: you can always lower rates later.
Debt Deficits and Momentum: What Could Go Wrong?
Lots. Neither fiscal policy nor monetary policy is starting from a good place to tackle the potential inflation challenges from a prolonged negative supply shock. Debt dynamics could see deficits and debts absolutely explode as interest rates climb and growth dips, constraining policy makers ability to soften the blow to demand and employment. Bond markets did discount some of this risk with those economies most at risk suffering most.
Debt dynamics are not well positioned to cope with rising sovereign financing needs which will rise as higher interest rates meet lower growth, primary deficits, and high debt ratios. If this risk case is realized, the outcome will also not be pretty.
The October 2025 IMF Fiscal Monitor presents some pretty disturbing data. The US and the UK are estimated this year to have gross debt ratios, the base on which debt momentum builds, of 133% and 105% of GDP respectively. Both countries are running a primary deficit of 4.0% and 1.0% of GDP and a revenue vs expenditure gap relative to GDP of 9% and 4%.
Markets have not fully priced-in this danger and are underappreciating the potential level of equilibrium real short-term interest rates needed to contain the potential inflation that may take the entire yield curve higher.
Diversification Benefit? What Diversification Benefit?
Everything we own is a discounted cash flow and many asset prices are vulnerable to drawdown, which might gain momentum in light of the financial leverage in the system. Diversification doesn’t work for you if bonds and equities both decline, which is what happens when the equilibrium interest rate re-prices at low interest rate starting levels.
A simple 60:40 asset mix of equities and bonds helped in the face of equity drawdowns in the 2010s. There were about five notable S&P500 corrections between 2010 and 2020 where the S&P500 declined in a range between 15% and 35% and UST’s rose in a range of 5% and 25%. So diversification helped. However, between January 2022 and October 2022, when monetary policy tightened to lift the equilibrium rate of interest higher, both the S&P500 and US Treasuries declined by about 15% as there was no diversification in this simple asset mix.
In this world investors likely won’t receive much of a diversification benefit if real short rates must rise but instead need some downside protection – an obvious trade is to buy short break-evens -- especially if ugly debt dynamics get a grip of the bond market.
There is a lot to play for in the next six months, and bad debt dynamics may become top of mind.
I’ll deal with that interesting dynamic in a week or so.